
El Niño Watch Raises Odds of a Wetter California Winter—But Guarantees Remain Elusive
El Niño is being watched again—here’s what that actually means
Scientists at the National Oceanic and Atmospheric Administration (NOAA) have issued an “El Niño Watch” for this summer, pointing to a 62% chance that El Niño conditions will develop from June through August. NOAA’s outlook indicates those odds rise to 83% by October. The announcement has quickly fueled familiar waves of dramatic language—talk of “Super El Niños,” “Godzilla El Niños,” and other attention-grabbing labels that can make a complex ocean-atmosphere pattern sound like a single, inevitable event.
But El Niño is not a switch that flips California from dry to wet. It is a shift in ocean temperatures and atmospheric circulation that nudges probabilities. That distinction matters, especially in a state where water planning, flood preparation, and public expectations can be shaped by seasonal headlines.
To clarify what an El Niño Watch does—and does not—signal for California, veteran meteorologist Jan Null has offered a grounded explanation based on decades of forecasting experience and the historical record. His message is consistent: El Niño can tilt the odds toward wetter conditions in parts of California, but it does not guarantee them.
El Niño and La Niña, explained in basic terms
El Niño and La Niña are two phases of a recurring climate pattern tied to sea surface temperatures in the tropical Pacific Ocean. In simple terms, El Niño refers to a warming of ocean waters in the tropical Pacific along the equator, stretching from off the Mexico coast toward the middle of the Pacific. La Niña is the opposite pattern—cooler-than-normal waters in that same region.
These changes in water temperature matter because they influence atmospheric circulation. When the ocean and atmosphere shift together, the impacts can ripple outward, affecting weather patterns well beyond the tropics. The key point is that El Niño and La Niña are not local California phenomena. They are large-scale patterns that can influence weather around the world.
Null notes that El Niño tends to occur every 3 to 7 years or so. That cadence can make it feel like a familiar storyline—especially after a notable wet winter—but the outcomes vary from one event to the next.
How El Niño can reshape weather patterns across regions
In broad terms, El Niño is associated with recognizable tendencies across different parts of the world. In North America, Null says El Niño increases the likelihood of warmer- and drier-than-normal conditions in the Pacific Northwest and Canada, while raising the odds of wetter-than-normal conditions across the southern tier of the United States, including Southern California.
Outside North America, the pattern can also align with drier-than-normal conditions in places such as the Amazon Basin, as well as Indonesia and Australia. These are large-scale tendencies, not precise forecasts for any one city or week.
El Niño is also linked to changes in hurricane activity. Null explains that during El Niño years there is typically a decrease in hurricane activity in the Atlantic. That does not mean hurricanes disappear, but the number of storms often drops. Meanwhile, the eastern Pacific Ocean off Mexico and Central America tends to see hurricane numbers increase during El Niño years.
Crucially, Null emphasizes that these relationships are based on averages across many years. They describe a statistical tilt, not a guarantee. One of the most persistent misconceptions, he says, is treating these broad trends as absolutes.
The California myth: El Niño equals wet, La Niña equals drought
Few weather ideas in California are as widespread as the belief that El Niño automatically delivers a wet winter, while La Niña locks in drought. The reality is more complicated.
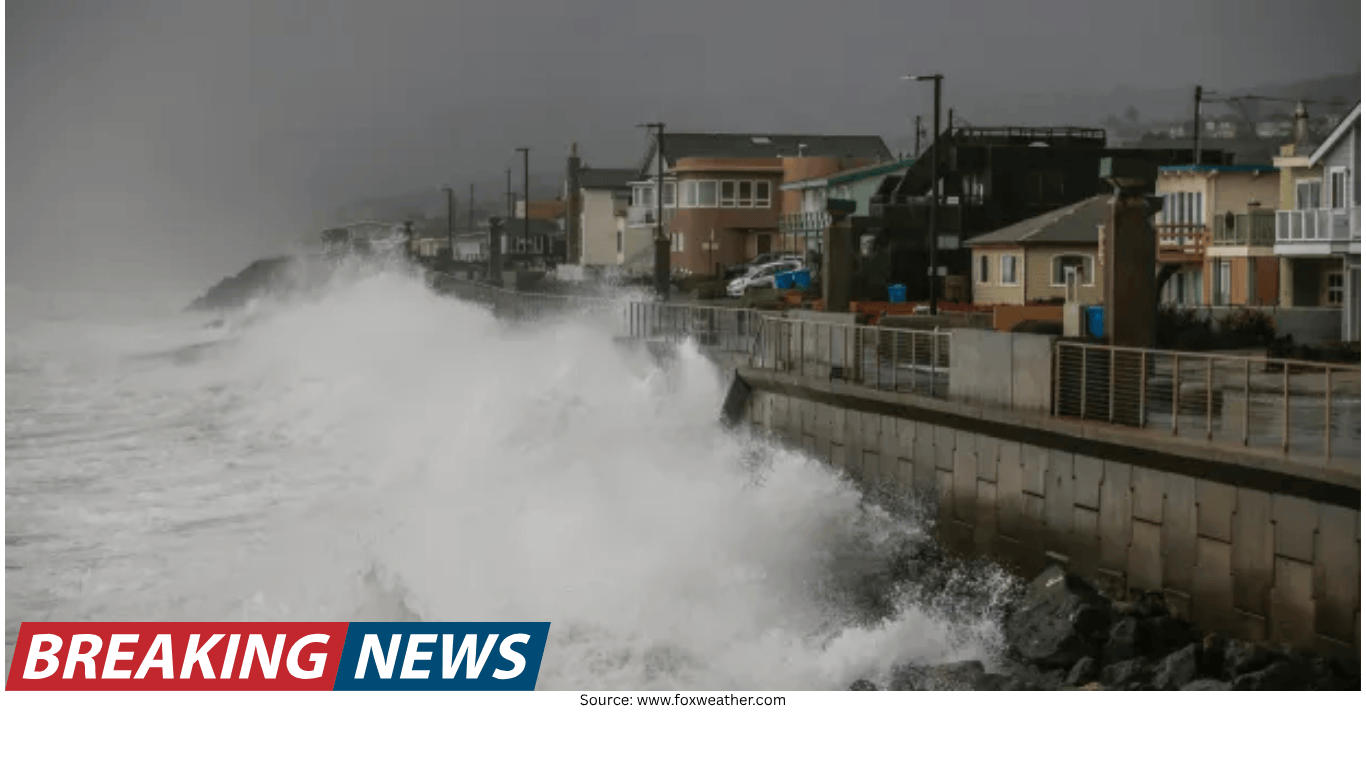
Null’s assessment: on average, California tends to be wetter during El Niño events. However, “average” is doing a lot of work in that sentence. The state’s rainfall outcomes during El Niño years have varied widely, and the historical record shows that below-normal rainfall is far from rare even when El Niño is present.
Since 1950, there have been 27 El Niño events. In the Bay Area, rainfall was below normal in 12 of those years and above normal in 15. In Los Angeles, 10 El Niño years produced below-normal rainfall and 17 produced above-normal rainfall.
Those numbers point to a practical takeaway: El Niño does not guarantee above-normal rainfall in any part of California. Instead, it increases the frequency of above-normal rainfall—more in Southern California than in the Bay Area, and even less as you go farther north.
In other words, El Niño can improve the odds of a wet winter in California, but the confidence level varies by region and is never absolute.
Why “Super El Niño” headlines persist—and what strong events have actually delivered
When warm waters begin building in the tropical Pacific, the conversation often escalates quickly. Null traces some of today’s hype to the legacy of the winter of 1997–98, a season that became a reference point for the public imagination. That year, he recalls, the hype was intense—and California ended up with roughly double the normal rainfall, with many rainy days.
That experience helped cement the idea that a very strong El Niño equals an exceptionally wet California winter. But the more complete record shows that even very strong events can produce different outcomes.
Null points to three very strong El Niño events in recent history: 1982–83, 1997–98, and 2015–16. These were years when Pacific Ocean water temperatures were at the top end of the scale, placing them in the “very strong El Niño” category.
1982–83: The Bay Area received 195% of normal rainfall, with flooding.
1997–98: The Bay Area received 180% of normal rainfall.
2015–16: The Bay Area received 99% of normal rainfall.
The pattern is revealing: two of the three very strong El Niños were notably wet in the Bay Area, but one was essentially normal. For Null, that “two out of three” is the point. Even when the ocean signal is strong, the outcome in California is not guaranteed.
Climate change and El Niño: a developing picture
Null describes the relationship between climate change and El Niño as an area where scientists are still “getting a handle” on the details. What is clearer, he says, is that oceans are warmer overall. And in a warmer world, certain weather impacts can intensify.
When storms arrive, they tend to be wetter. When droughts and heat waves occur, they tend to be drier and hotter. Null frames it as a kind of fingerprint: every weather event has some “climate change DNA” in it. The difficult part is separating what is natural variability from what has been “supercharged” by a hotter climate.
To sort that out, he argues, it is important to look at longer-term patterns—decadal numbers—rather than focusing on a single season. Questions that matter include how the frequency of wet events changes across the 1980s, 1990s, 2000s, 2010s, and 2020s.
Forecasting has improved—but the limits still matter
One reason seasonal outlooks can be confusing is that they arrive alongside daily forecasts that often feel precise. Yet the two are not the same kind of prediction.
Null explains that forecast accuracy has improved significantly since he began working in the 1970s. At that time, a “good forecast” extended about three days. Today, he says, forecasters have “a pretty good handle” out to about seven days. He describes the improvement as roughly one day per decade.
Several factors have driven that progress:
Increasing computing power
Satellite observations
More buoys and better coverage in areas that previously lacked data
More data points feeding into computer models
Growing use of AI to analyze more data, especially historical data, to identify patterns
Even with these advances, the practical ceiling for detailed, day-to-day accuracy remains about a week. That raises a reasonable question: if daily forecasts struggle beyond seven days, how can agencies issue El Niño outlooks months ahead?
Seasonal outlooks are probabilities, not day-by-day predictions
Null’s answer is that seasonal outlooks and daily forecasts are built differently. NOAA and other agencies are not claiming they can forecast the exact weather on a specific day in July or September months in advance. Instead, they examine current ocean temperatures and atmospheric changes to estimate the likelihood of broader conditions developing.
These are “more general probabilities,” he says, informed by variations on climate models. The result is not an exact temperature and rainfall schedule, but a risk assessment—an odds shift based on what the ocean and atmosphere are doing now.
That distinction helps explain why an El Niño Watch can be meaningful without being deterministic. It is a sign that conditions are trending toward a particular phase, not a promise of a particular winter outcome in California.
Why better long-range precision would be economically transformative
If someone could precisely predict temperatures and rainfall totals many months ahead, the value would extend far beyond curiosity. Null notes that roughly one-third of the U.S. economy is weather sensitive. More accurate long-range precision would influence decisions across energy, agriculture, and commerce.
He illustrates the point with everyday examples—everything from energy prices to how retailers decide “how many puffy ski jackets to sell next winter.” The implication is straightforward: the demand for better long-range forecasting is enormous, and the stakes are high.
Public misconceptions: the promise and peril of weather apps
Among the misconceptions Null encounters, one stands out: the public’s faith in weather apps. He argues that many people assume that if a forecast appears on a phone, it must be exactly what will happen. In practice, app forecasts can vary, and the way they present information can create a false sense of certainty.
Null encourages people to consult official local forecasts from the National Weather Service. He also points to an app, “Everything Weather,” which is based on National Weather Service forecast data.
His broader point connects back to El Niño itself: weather is probabilistic and complex. A single label—El Niño, La Niña, “super”—can be tempting shorthand, but it does not replace the nuanced reality that these patterns shift the odds rather than dictate outcomes.
What to take away from the current El Niño Watch
NOAA’s El Niño Watch, with odds rising from summer into fall, is a sign that the tropical Pacific may be moving toward El Niño conditions. That matters because El Niño can influence atmospheric circulation and, on average, can increase the likelihood of wetter conditions in parts of California—especially in the south.
At the same time, the historical record makes clear that California’s relationship with El Niño is not a simple cause-and-effect. Even among very strong El Niño events, outcomes have ranged from flooding and well-above-normal rainfall to essentially normal totals in the Bay Area.
For Californians tracking the months ahead, the most useful stance is informed caution: pay attention to updated outlooks, understand that they are probability-based, and avoid treating any single seasonal signal as a guaranteed script for winter.
About the meteorologist referenced
Jan Null is a veteran meteorologist who worked at the National Weather Service from 1974 to 1997, including as a lead forecaster from 1983 to 1997. He founded Golden Gate Weather Services, a consulting firm based in Half Moon Bay, in 1997. He has also served as an adjunct professor and lecturer in meteorology at San Francisco State University (1987–2012) and at San Jose State University (2013–16). His education includes a B.S. in Atmospheric Science from UC Davis (1974) and an M.A. in geography/climate from San Jose State University (1992).